About C-Crop Technology
C-Crop technology platform revolutionizes fruit crop management across the value chain by providing stakeholders an accurate data accessible anytime and anywhere from smartphone devices
C-Crop technology
Few simple steps to measure your crop yieldי
2. Utilize the app's video recording feature to capture short videos of your plot. Ensure that you evenly spread the samples throughout the plot.
3. Once you have an internet connection, all videos will be automatically uploaded to C-Crop cloud.
4. After the processing is complete, which occurs rapidly and depends on your internet connection, you will receive a user-friendly report directly to your C-Crop application and desktop
C-Crop Value for You
2. Performance Optimization: Identify and address performance gaps in plots to ensure optimal growth and productivity
3. Yield Forecasting and Quality Assessment: Determine yield forecasts and quality from early growing stages. Sharing accurate, standardized yield data among stakeholders improves efficiency and reduces costs across the entire market channel.
4. Innovation Enhancement: Accurate, standardized yield data facilitate the development and implementation of new treatments, varieties, and practices.
A Case Study: Accurate Table Grape Yield Measurement
Objective:
To accurately measure the yield performance of a 4-hectare table grape vineyard plot in South Africa.
Data Collection:
* Approximately 300 video samples were taken in the vineyard, about 50 days before harvest, following C-Crop’s manual guide.
* This data was automatically uploaded to the C-Crop secure analysis platform
Data Analysis:
* The video samples were analyzed using C-Crop’s platform, showing how the yield and its characteristics (cluster density and size, and berry number and size) are distributed within the plot.
* The calculated yield was then compared to the actual harvested yield
Outcome:
* The C-Crop platform achieved more than 90% accuracy in calculating yield and yield characteristics
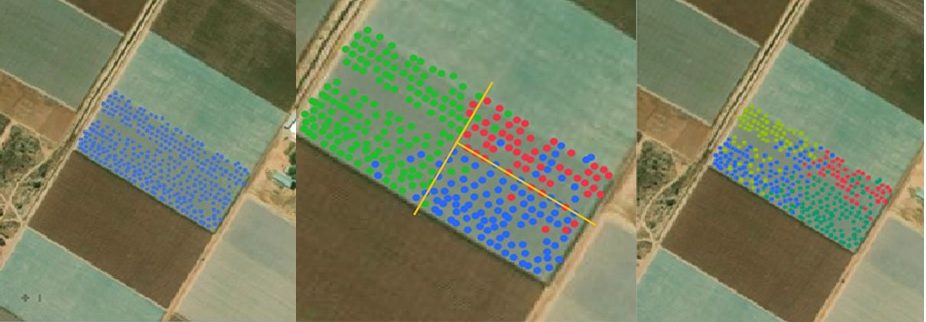
* C-Crop platform identified high variability in yield distribution within the plot, revealing two distinct sub-plots with a 40% difference in yield between them (highest in blue vs. lowest in red).
* Further investigation by the agrotechnical team found that this difference was due to an improper operation of one of the irrigation controllers that were responsible for regular irrigation of the plot